
Hi everyone! We all want our applications to be fast, responsive, and scalable. But often, we focus just on writing efficient queries and forget to look deeper at the actual engine that powers those queries.
In this blog, we’re going to explore what truly drives performance in MySQL by understanding both metrics and parameters.
- Metrics show how MySQL is performing.
- Parameters define how MySQL should behave.
So, when do we usually realize something’s wrong?
- Users complain the app is slow.
- Queries that used to take seconds now take minutes.
- CPU or memory usage is high.
These are all signals. But to find the real root cause, we need to dig into metrics.
Defining Performance: The Spectrum
Before we can improve performance, we need to know what our database’s performance actually looks like—the good, the bad, and the ideal. That’s where the Performance Spectrum helps.
- Normal Performance: This is your baseline. It’s how your system behaves on a typical day: stable response times and predictable load.But remember, normal is different for every app — so knowing your baseline is key.
- Efficient Performance: This is where you’ve tuned things well. Queries are fast, resource usage is low, and throughput is high. You’re getting more done with less—and that’s the goal.
- Degraded Performance: This is when things slow down, errors show up, and the system starts to feel overloaded. That’s your early warning sign.
So this spectrum — from degraded to efficient — gives us a framework.The rest of this post is about helping you move closer to that efficient zone.
Essential Performance Indicators (KPIs)
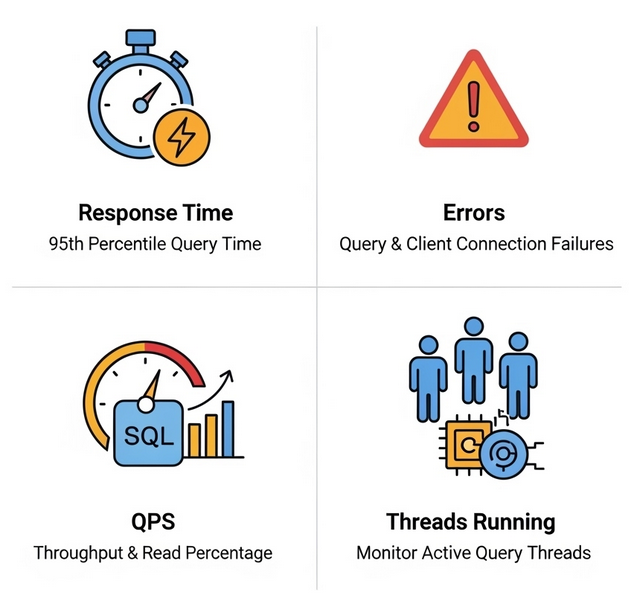
Let’s talk about how to take the pulse of your MySQL server. We do that by focusing on four key performance indicators (KPIs)—think of them like vital signs. If these four look good, chances are your system is healthy.
Response Time:
- How long does it take for a query to return results? This is something users feel immediately. Instead of relying on averages, which can be misleading, look at the 95th percentile. This shows how long 95% of your queries are really taking. You can track this in the
performance_schema.events_statements_histogram_globaltable.
Errors:
- Things like failed queries, aborted connections, or timeouts are red flags. Even small spikes are a sign of instability, high load, or a bad configuration. Monitor the
performance_schema.events_errors_summary_global_by_errortable to track different error types.
QPS (Queries Per Second):
- This is your throughput indicator. A high QPS isn’t inherently bad; it often means your system is doing a lot of work. The real question is: can it handle that load efficiently? You can calculate QPS from
SHOW GLOBAL STATUSby looking atQueriesandUptime.
Threads Running:
- This powerful metric shows how many queries are actively executing right now. If it’s consistently more than twice your CPU core count, you’re likely hitting CPU contention. But when you have high QPS and low
Threads_running, that’s true efficiency.
Together, these four KPIs give you a clear, real-time view of your database’s health.
The Performance Equation: External & Internal Influences
MySQL performance isn’t just about tuning the database; it’s shaped by everything around it. Let’s look at the factors that can make or break performance, both outside and inside the MySQL engine.

External Influences
1. Hardware:
- CPU: The brain for query execution. If utilization is consistently over 90%, you’re likely beyond capacity.
- Memory (RAM): All about caching. Not enough RAM? MySQL reads from disk, which is far slower. If RAM usage is constantly over 95%, your system may start swapping, which kills performance.
- Storage (Disk I/O): How fast your data is read and written. IOPS (input/output operations per second) tells you if your storage can keep up under load.
- Network: A slow or unstable network between the app and the database will bottleneck everything, regardless of how fast your database server is.
2. OS Settings
On Linux, a few key settings make a big difference:
- Set swappiness to 1 to reduce disk swapping.
swappiness is a Linux kernel parameter that controls how aggressively the system swaps inactive memory pages from RAM to disk. The value can range from 0 to 100. A high value (e.g., the default of 60) means the kernel will be more eager to swap data to disk, even if there is still free RAM.
How it helps MySQL performance:
MySQL’s InnoDB Buffer Pool is its most important cache. It keeps frequently accessed data and indexes in RAM to avoid slow disk reads. If the OS starts swapping parts of the Buffer Pool out to disk, every read to that swapped-out page suddenly becomes a sluggish disk I/O operation. This completely defeats the purpose of having a large in-memory cache.
By setting swappiness to a low value like 1, you tell the OS: “Only swap to disk as an absolute last resort.” This keeps critical MySQL data in RAM, preventing performance from falling off a cliff when memory pressure increases. For a dedicated database server, you want to keep swapping to a minimum, if not eliminate it entirely.
- Disable Transparent Huge Pages
Transparent Huge Pages (THP) is a Linux memory management feature that attempts to use larger memory pages (2MB instead of 4KB) for memory allocation. It’s designed to improve performance by reducing the number of page table entries for applications that use large amounts of memory.
How it helps MySQL performance: While THP can be great for some applications, it can be detrimental to MySQL’s InnoDB storage engine. Here’s why:
- Memory Fragmentation: THP can cause significant memory fragmentation, making it difficult for the OS to find contiguous blocks of memory for other allocations.
- Performance Spikes: The THP background compaction process can introduce sudden, unpredictable latency spikes. When the kernel is busy rearranging memory to create huge pages, it can cause brief but noticeable stalls in MySQL’s activity, impacting query response times.
Since InnoDB has its own highly optimized memory management, it’s generally recommended to disable THP for MySQL workloads to ensure consistent, stable performance and prevent these sudden latency hiccups.
- Tweak
oom_score_adj
The Linux Out-of-Memory (OOM) Killer is a kernel mechanism that kicks in when the system runs out of RAM. It’s a last-resort measure to prevent a system crash, and it works by terminating processes with a high “oom score.” The oom_score_adj parameter allows you to adjust a process’s score, making it more or less likely to be killed.
How it helps MySQL performance: In a low-memory situation, you never want your database server—which holds all your data and state—to be the first process the OS kills. When the OOM Killer terminates MySQL, it requires a full restart and recovery process, which can take a long time and result in significant downtime for your application.
By setting a negative oom_score_adj value for the MySQL process, you tell the OOM Killer to consider other, less critical processes first. This gives MySQL a higher chance of surviving a memory crunch, preserving uptime and stability.
- Enabling Jemalloc
Jemalloc is a high-performance memory allocator designed for multithreaded applications. It is an alternative to the default glibc memory allocator.
How it helps MySQL performance: MySQL is a highly multithreaded application. The default memory allocator can struggle with concurrent memory requests, leading to contention and performance bottlenecks. Jemalloc is optimized for concurrency and provides:
- Superior Scalability: It uses a lock-free design and per-CPU data structures to handle memory allocation in parallel, which is a perfect fit for a multi threaded server like MySQL.
- Reduced Fragmentation: It is designed to minimize memory fragmentation, which ensures more efficient use of your server’s RAM over time.
- Better Performance: It can lead to faster memory allocation and de allocation, resulting in a measurable performance boost in memory-intensive workloads.
By enabling Jemalloc, you provide a more robust and scalable foundation for MySQL to manage its memory, leading to better overall performance and stability.
3. Application Layer:
Bad app logic can undo great database tuning. The classic N+1 query problem (sending dozens of queries in a loop instead of one), missing indexes, or poor connection management all silently exhaust your database.
Tuning only MySQL isn’t enough. You need the whole system—hardware, OS, and app—working in sync.
Inside the MySQL Engine
Now let’s go under the hood. This is where real performance tuning starts to take shape.
- MySQL Configuration: MySQL has hundreds of tunable variables. A handful of these can make a huge impact on how it uses CPU, memory, and disk I/O.
- Schema Design: This is your foundation. Poorly designed schemas lead to slow queries no matter how powerful your server is. Choose the right data types, keep relationships clean, and know when to normalize or de normalize.
- Indexing Strategy: Indexes are your best friends. A well-placed index can make a query 100x faster. But too many, or the wrong kind, can also slow things down.
- Query Optimization: Use
EXPLAINandEXPLAIN ANALYZEto see what the MySQL optimizer plans to do. Learning to read these plans is key to writing better queries. - Locking: If too many queries try to lock the same rows or tables at the same time, they pile up and wait. This is lock contention—a silent performance killer under concurrency.
- Caching (InnoDB Buffer Pool): This is MySQL’s most important memory structure. It holds frequently accessed data and indexes in RAM. If the buffer pool is well-sized, disk reads go way down, and performance goes way up.
These six areas are the big levers you can pull to dramatically improve your server’s performance.
Six Classes of Performance Signals

MySQL gives us hundreds of metrics. How do we make sense of it all? The trick is to group them into six core categories. Think of these as filters that help you interpret the signals.
- Response Time: How long is it taking?
- This is all about user experience. How long does a query take to run? How long does it take to connect? If this is high — users are waiting. And when users wait, they get frustrated.
- Rate (Throughput): How fast is it working?
- This is about volume over time — queries per second, transactions per second, data transfer rates. Generally, higher is good — but a spike could also mean rising pressure on your system.
- Utilization (Saturation): How full is it?
- This tells us how much of your system’s resources are in use — CPU, RAM, disk I/O, threads. If you’re constantly above 90%, you’re probably near or at saturation — and you’ll start seeing bottlenecks.
- Wait: What is MySQL waiting for?
- Sometimes MySQL isn’t actively doing work — it’s just waiting. For a lock to release. For disk I/O to finish. For CPU time. Wait metrics help you identify these hidden delays.
- Error: Did something go wrong?
- These are the alarm bells: aborted connections, failed queries, server errors. Even small spikes here can point to deeper issues that need fixing fast.
- Access Pattern: How is MySQL being used?
- This gives insight into how your application is behaving — are you doing a lot of reads, writes, big joins, temporary tables? Understanding this helps you tailor MySQL to your workload.
Now, you might be thinking — this structure is useful, but how does it actually help me troubleshoot?
Here’s how:
When a performance issue hits, Let’s say your app is slow, you don’t have time to stare at 500 metrics hoping something obvious jumps out. These six classes give you a mental checklist — a quick way to sort the issue out,
- Start with Response Time: is the database really slower?
- If yes, check Waits — are queries blocked or delayed?
- Then look at Utilization — is the server maxed out on CPU or disk?
- Still unclear? Check for Errors, and review Access Pattern issues — like a sudden spike in expensive joins or unindexed queries.
This structure helps you narrow down the cause fast and go from “something is wrong” to “this is what we need to fix.”
Key Metrics
Let’s dive into some of the most insightful metrics.
Concurrency & Temporary Objects
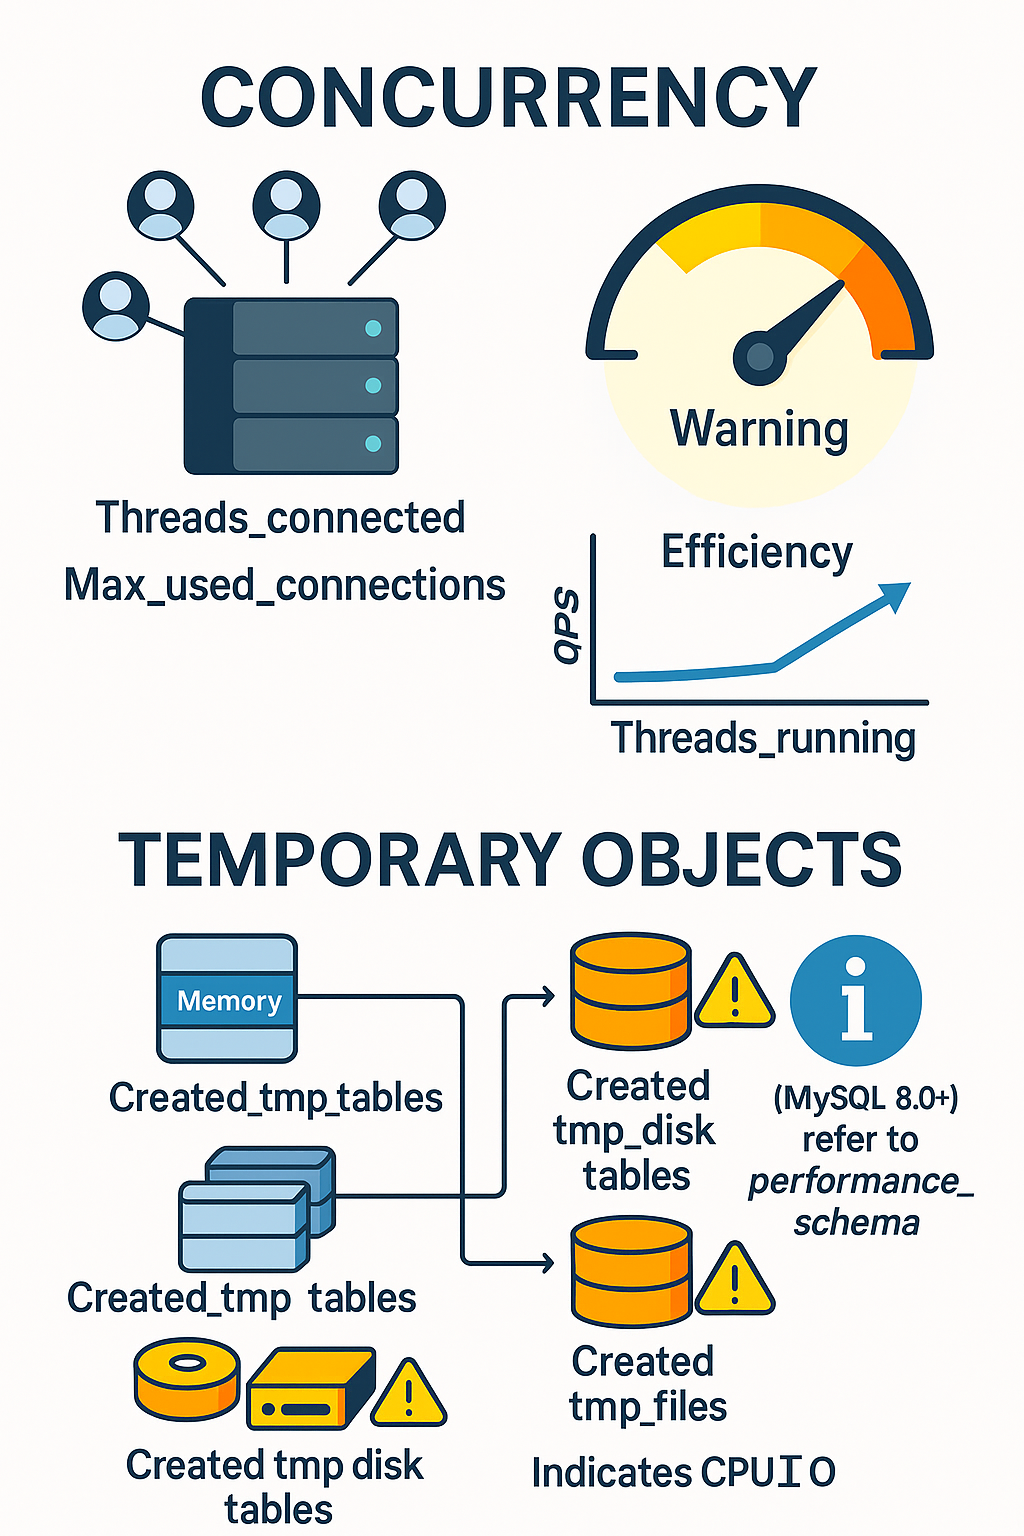
Threads_connected: Just the number of open connections. It doesn’t tell you how busy the server is.Threads_running: The real gem. This shows how many queries are actively running. If it’s consistently higher than twice your CPU core count, your CPU is likely overloaded. High QPS with lowThreads_runningis a great sign of efficiency.Max_used_connections: Shows the peak number of connections used. If this is close to yourmax_connectionslimit, your app may need more connection capacity.Created_tmp_disk_tables: This tracks temporary tables that had to be created on disk because they didn’t fit in memory. This is much slower than in-memory tables.- Note for MySQL 8.0+: This metric is not used by the new TempTable(Memory) storage engine. Instead, monitor
memory/temptable/physical_disk_bytes_writtenin Performance Schema.
- Note for MySQL 8.0+: This metric is not used by the new TempTable(Memory) storage engine. Instead, monitor
Created_tmp_files: Similar toCreated_tmp_disk_tables, these show up when the server is under memory pressure. If you see too many disk-based temporary tables, yourtmp_table_sizeandmax_heap_table_sizeare likely set too low.
Bad Queries & Transaction Health
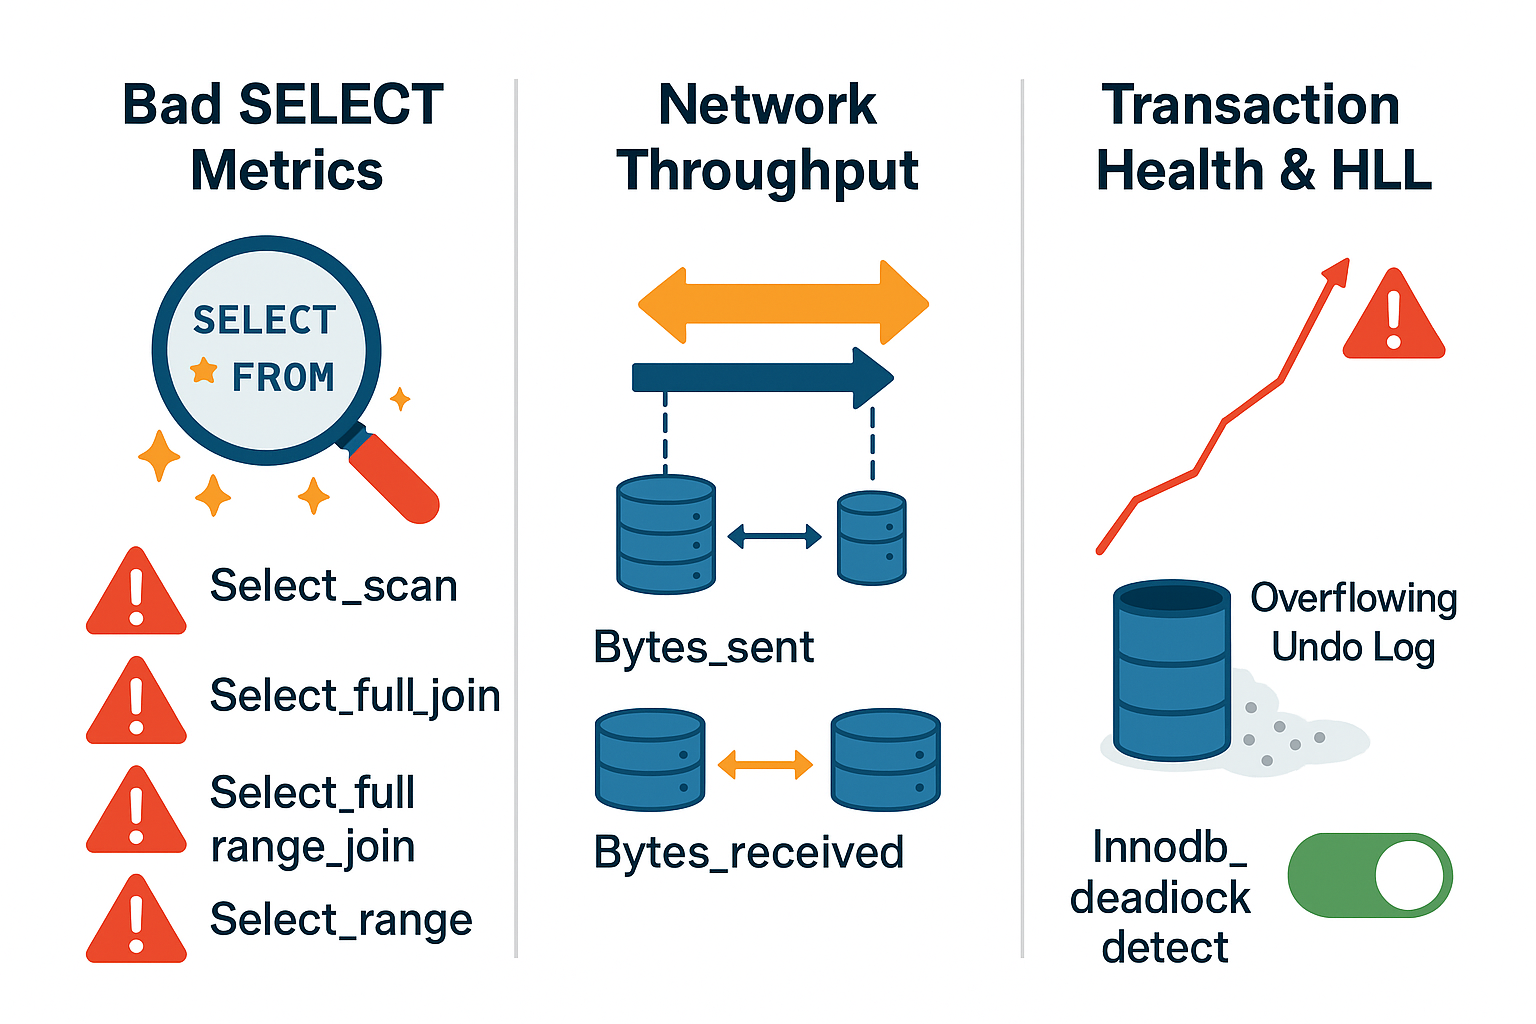
- Bad SELECTs (
Select_scan,Select_full_join, etc.): High values here mean your queries are likely missing indexes. ASelect_scanmeans MySQL scanned the entire table, which is a major performance hit on large tables. - Network Throughput (
Bytes_sent,Bytes_received): If this is unusually high, your app might be pulling too much data or the network could be a bottleneck. - History List Length (HLL): Tracked by Innodb_trx_rseg_history_len. If this number keeps growing (e.g., past 100,000), it usually means there’s a long-running transaction still open. This bloats memory and can slow down background processes.
innodb_deadlock_detect: Enabled by default, this helps resolve deadlocks. But in ultra-high concurrency, its overhead can be significant. Consider turning it off only if you have robust application-level deadlock handling.
Locking & InnoDB I/O

- Row Lock Contention (
Innodb_row_lock_time,Innodb_row_lock_current_waits,Innodb_row_lock_waits): If these numbers are climbing, queries are getting stuck waiting for locks. This is often caused by long-running transactions or missing indexes. - InnoDB I/O (
Innodb_data_reads,Innodb_os_data_writes): This is all about how MySQL talks to your disk. High read IOPS can mean your buffer pool isn’t large enough to cache your working set.
Buffer Pool & Transaction Log Health
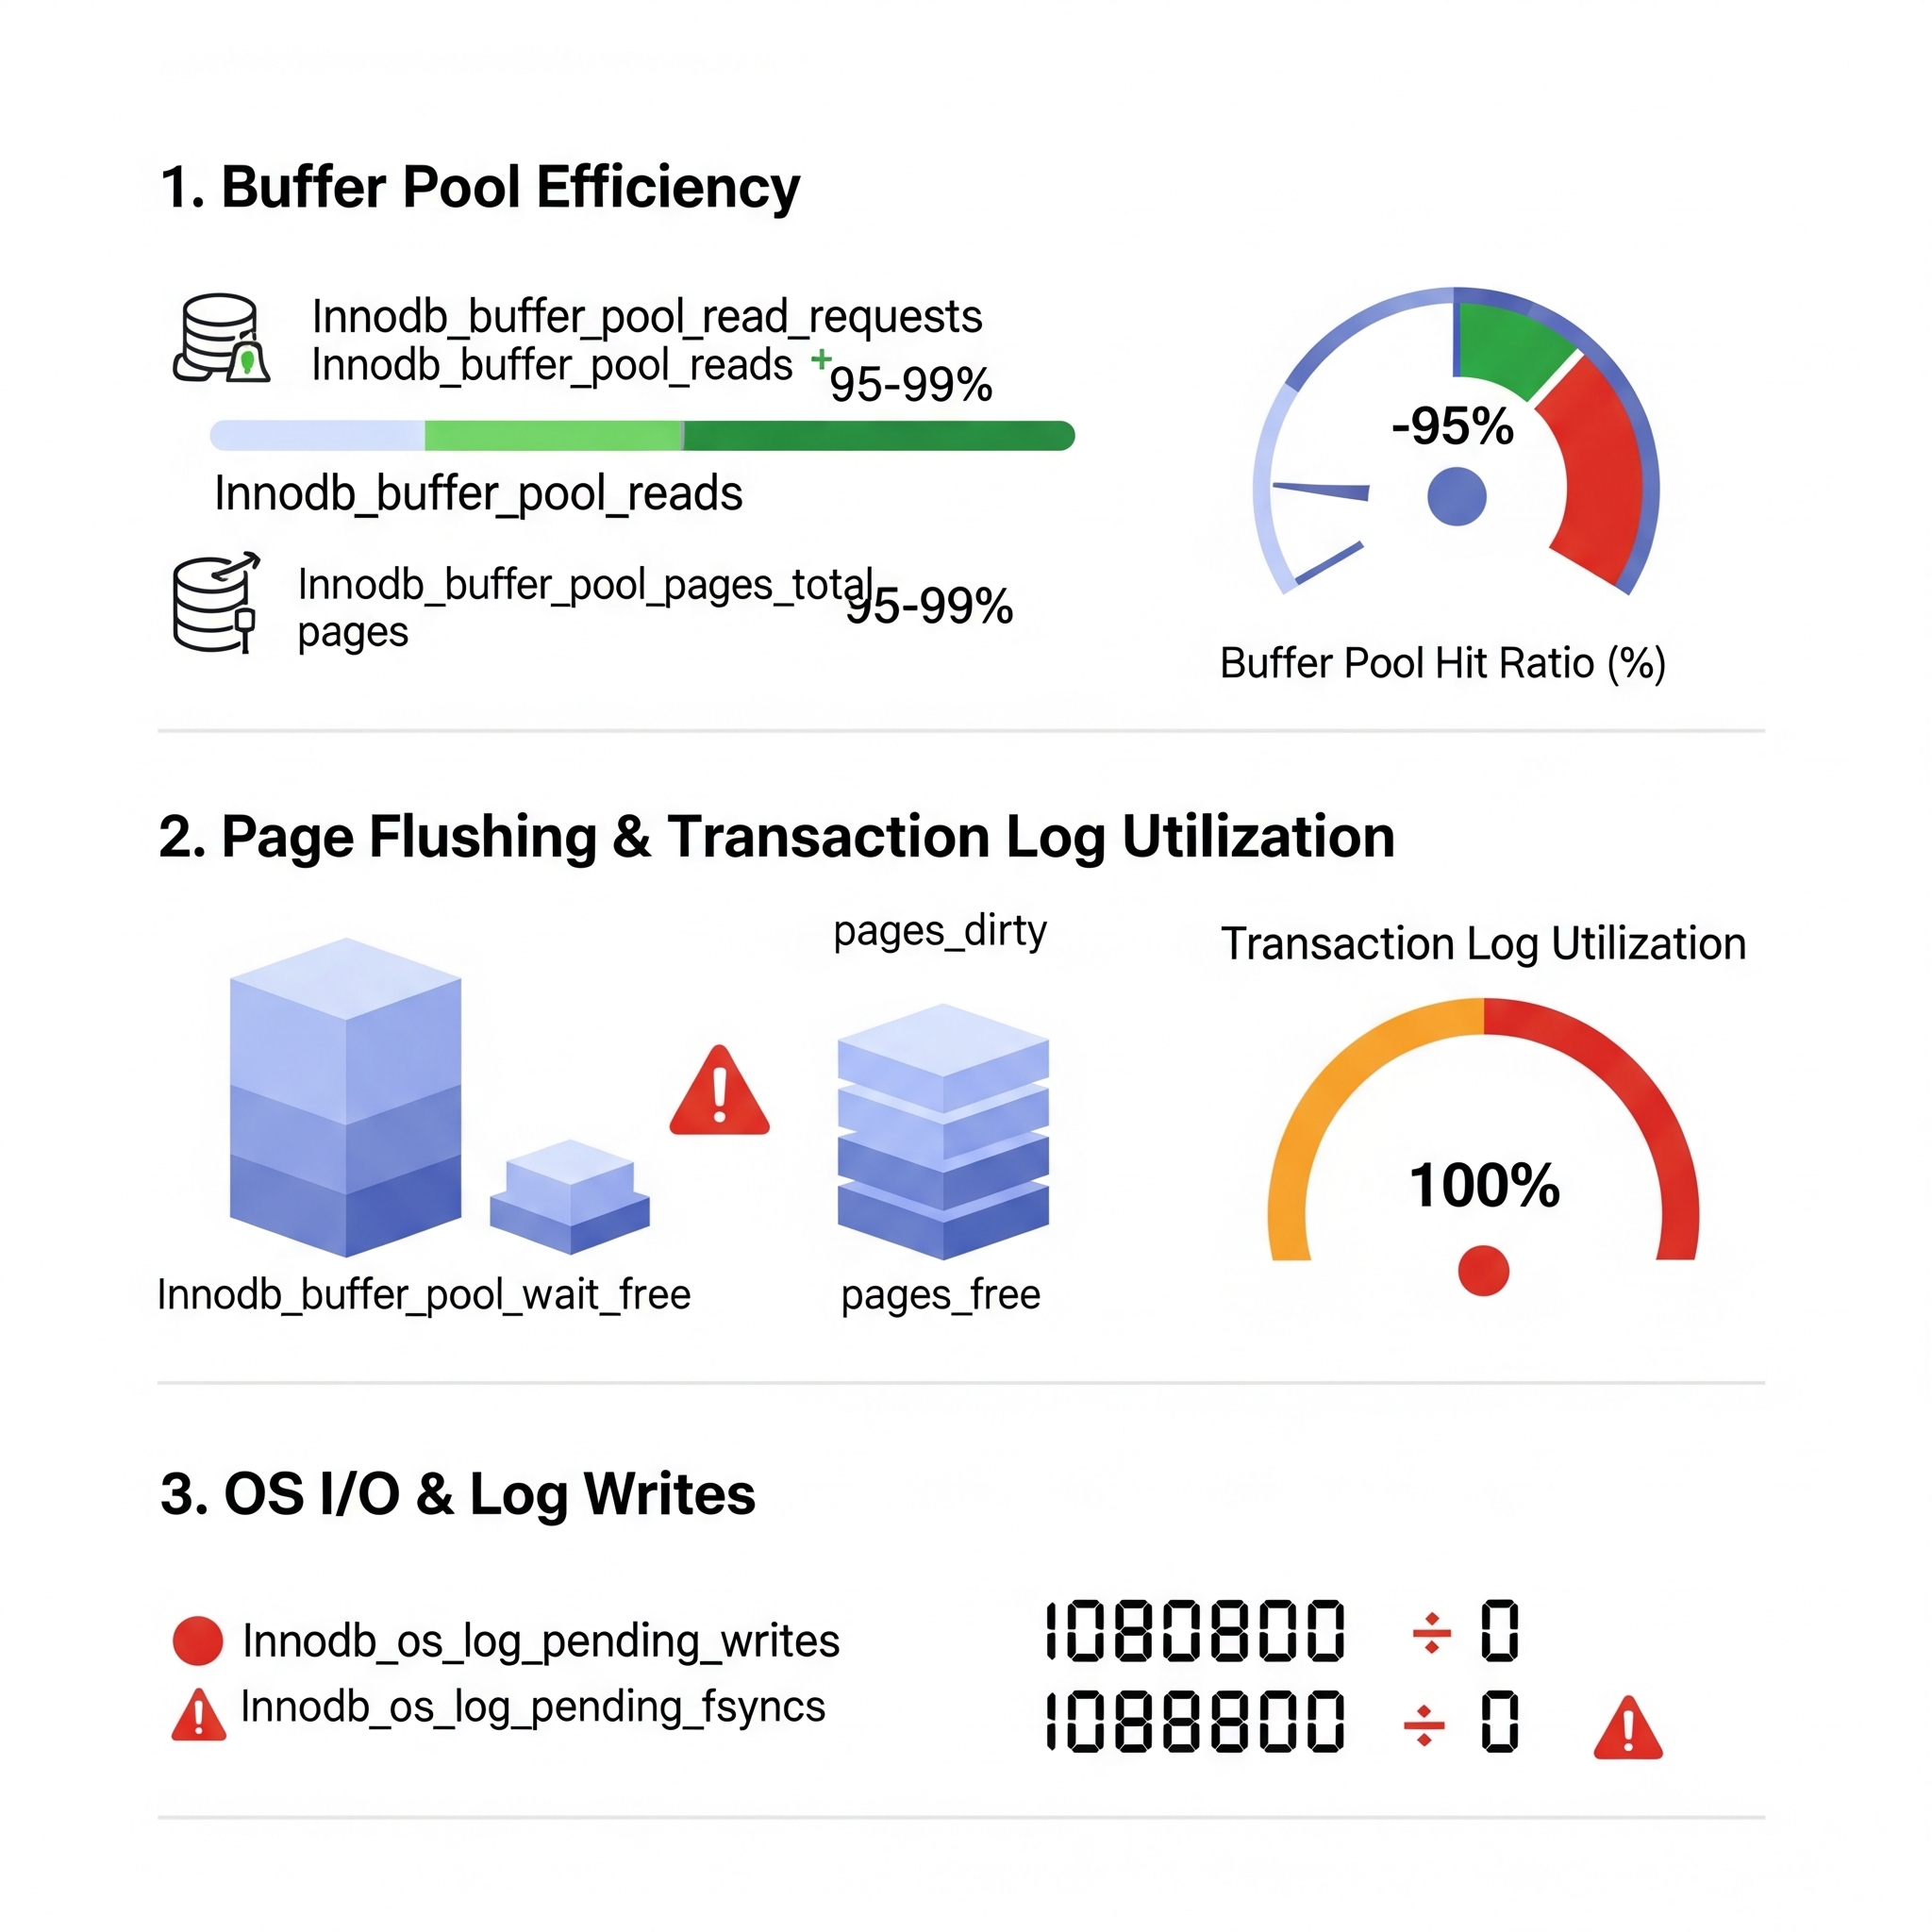
- Buffer Pool Hit Ratio: Calculated from
Innodb_buffer_pool_read_requests(in-memory reads) andInnodb_buffer_pool_reads(physical disk reads). You want this above 95%, ideally 99%. - Innodb_buffer_pool_wait_free: If this metric is increasing, it means MySQL had to wait for free pages in the buffer pool. This is a sign it’s either too small or not flushing quickly enough.
- Transaction Log (Log_lsn_checkpoint_age, Log_max_modified_age_async): These metrics tell you how full the redo log is. If it’s nearing 100% utilization, InnoDB is under pressure.
- Log_waits: If this is climbing, your
innodb_log_buffer_sizeis likely too small. - Innodb_os_log_pending_writes and fsyncs — these show if InnoDB is waiting for the OS to flush data to disk. These should be zero. If not, it’s a serious I/O bottleneck — or slow storage.
Key MySQL Parameters: Dynamic and Static
Dynamic Adjustments (No Restart Needed)
| Parameter | Purpose/Role | Recommended Setting / Guideline |
| innodb_buffer_pool_size | Caches data and indexes in Memory | 70–80% of total RAM (leave 20–30% for OS and other needs) |
| innodb_redo_log_capacity | Total disk space used by redo logs (MySQL 8.0.30+) | ~1/4 of innodb_buffer_pool_size; larger = better performance, slower crash recovery |
| innodb_log_buffer_size | In-memory buffer for transaction logs before flushing | Default 16MB is fine; increase if you see Log_waits or run large transactions |
| innodb_flush_log_at_trx_commit | Controls durability vs. performance trade-off | 1 = safest (ACID); 0 or 2 = faster but risk some data loss on crash |
| innodb_io_capacity | Hints MySQL how many IOPS your storage can handle for background tasks | HDD: 200; SSD: 2000–5000; NVMe: 20,000+ |
| innodb_io_capacity_max | Max burst IOPS allowed for aggressive flushing | Typically 2x innodb_io_capacity |
| innodb_adaptive_hash_index | Auto-creates hash indexes in memory | Leave ON unless profiling shows it causes mutex contention |
| table_open_cache | Number of table definitions/data files cached | Increase if Opened_tables is rising rapidly; balance with memory limits |
| sync_binlog | Controls how often binary log is flushed to disk (for durability) | 1 = safest (flush after each transaction); higher values = better performance |
| sort_buffer_size, join_buffer_size,read_buffer_size, read_rnd_buffer_size | Memory used per session for sorts, joins, reads | Tune per query/session if needed; don’t set too high globally |
Static Adjustments (Requires Restart)
| Parameter | Purpose/Role | Recommended Setting / Guideline |
| innodb_buffer_pool_instances | Splits buffer pool into multiple parts to reduce contention | Use 8+ instances for buffer pools >1GB; improves concurrency |
| innodb_flush_method | Defines how InnoDB writes to disk | O_DIRECT on Linux to avoid double buffering and reduce OS cache pressure |
| innodb_page_cleaners | Number of threads flushing dirty pages from buffer pool | 4–8 threads for write-heavy workloads with enough I/O capacity |
| innodb_purge_threads | Handles purging of old undo log records (linked to History List Length / MVCC) | 4–16 for high write workloads or when HLL stays consistently high |
| innodb_autoinc_lock_mode | Manages locking behavior for auto-increment columns | Default 2 (interleaved) in MySQL 8.0 is best for concurrent inserts |
| skip_name_resolve | Disables DNS resolution for incoming client connections | Enable (ON) for faster authentication and to avoid reverse DNS lookups |
The Performance Tuning Lifecycle

So far, we’ve talked a lot about metrics and parameters — what to measure and what to tune. But here’s the bigger question: How do you actually use all this knowledge in the real world?
Performance tuning isn’t a one-time fix. It’s a cycle — just like maintaining your health. You don’t go to the doctor once and declare yourself permanently healthy. You check in regularly, track key vitals, and make adjustments as needed.
Tuning MySQL works the same way — and here’s the lifecycle that makes it effective.”
Step 1: Identify the Problem
- Don’t just say, ‘MySQL is slow.’ Be specific. Is a particular query lagging? Has throughput dropped? If you can measure it, you can fix it.
Step 2: Collect Evidence
- Use tools like SHOW GLOBAL STATUS, Performance Schema, the slow query log, and OS tools like top and iostat. Establish your baseline — know what ‘normal’ looks like.
Step 3: Analyze & Diagnose
- Now dig into the data. Are you maxing out CPU? Is I/O overloaded? Are locks piling up? This is where those six metric classes come in — they help you pinpoint the actual bottleneck.
Step 4: Form a Hypothesis
- Think like a scientist: ‘If I add an index on this specific column, I expect query latency to drop by 50%.’ Make it specific and measurable.
Step 5: Test Safely
- Never test directly in production. Try your changes in staging or dev environments first. Validate them in a safe zone.
Step 6: Measure the Results
- Did the change help? Did CPU drop? Did queries speed up? Or did it introduce a side effect? Measure both the gain and the cost.
Step 7. Implement in Production (Cautiously)
- If your testing was successful, it’s time to go live — but go slow. Roll out incrementally if possible, and monitor closely. Be prepared to rollback quickly if something unexpected happens.
Step 8. Document Everything
Don’t skip this step! Keep a log of:
- What the issue was
- What you tried
- What worked
- What results you saw This saves you time in the future, helps new team members learn, and avoids repeating mistakes.
Step 9: Keep Monitoring
Because nothing stays the same. Workloads grow, patterns shift, and new problems arise. Ongoing monitoring is key..
So remember — great performance doesn’t come from guesswork. It comes from a structured, disciplined approach like this. Stick to the cycle, and you’ll be able to solve performance issues confidently and consistently.”
Common Anti-Patterns:
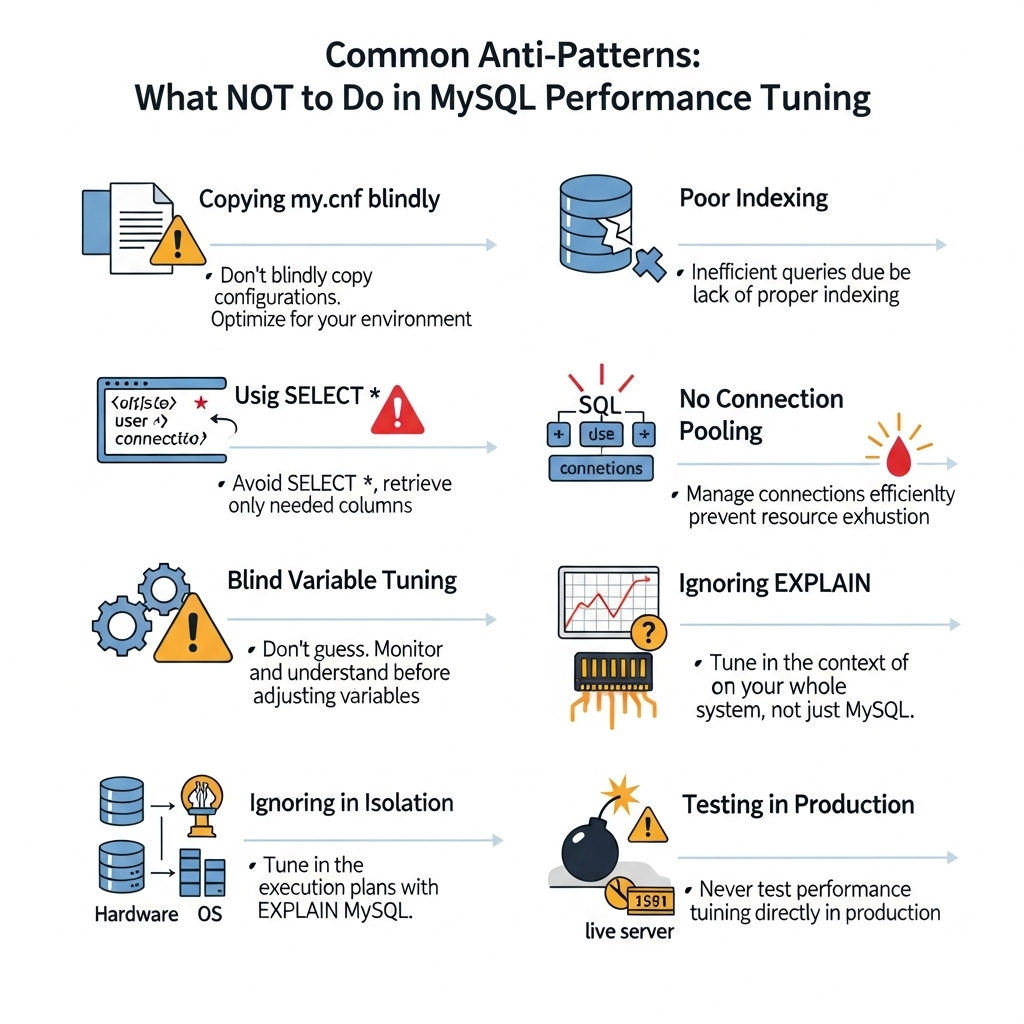
These are the classic anti-patterns — common habits that may seem harmless or even helpful, but can actually cause more harm than good. Let’s walk through them.
1. The “One-Size-Fits-All” Configuration
- Copy-pasting a my.cnf file from a blog or another server might sound like a shortcut — but it’s a trap.Every workload is different. A config that works great for an analytics system might crush a transactional one. Always understand your own workload, data size, and access patterns before applying changes.
2. Ignoring Indexes / Poor Indexing
- This is probably the first and foremost root cause of slow queries. Missing indexes. Redundant indexes. Wrong indexes. Even the most powerful server can struggle if queries are scanning entire tables unnecessarily.Get your indexing right. It’s the foundation of performance.
3. Using SELECT * in Production
It’s quick to write — but expensive to run. For example , Why pull all 20 columns when your app only needs 3? This wastes:
- Disk I/O
- Network bandwidth
- Memory buffers
Always select only what you need. It’s a small habit that scales beautifully.
No connection pooling? That’s a hidden killer.
- Too many direct connections eat up your max_connections limit. Use a connection pooler or proxy like ProxySQL to keep things scalable.
5. Blindly Increasing Variables
- More memory = better performance, right? Not always. Over-allocating memory — especially to settings like innodb_buffer_pool_size — can leave the OS with too little RAM, triggering swap, which is far worse than a slightly smaller buffer.
Tune based on available resources, and always leave headroom for the OS and other services.
6. Ignoring EXPLAIN and EXPLAIN ANALYZE?
That’s like driving blindfolded.These tools show you what MySQL is really doing. Use them to understand and fix slow queries
- EXPLAIN shows the execution plan.
- EXPLAIN ANALYZE goes a step further — showing actual run time details.
Use them. They turn slow queries into fast ones.
7. Tuning in Isolation
- Remember the Performance Equation? MySQL doesn’t operate alone. It’s part of a stack. You can tweak all the DB variables you want — but if your app logic is inefficient, or your server’s disk is slow, you won’t see real results.Always consider the full picture: application, OS, hardware, and MySQL together.
And finally — never tune directly in production without testing.
It might work… or it might crash your server at 2 AM. Always validate in staging first.So in short — smart tuning is just as much about “what to avoid as it is about what to do”
Key References:
- MySQL Official Documentation
- O’ Reilly – Efficient MySQL Performance by Daniel Nichter
- Releem Official Documentation
- Percona – MySQL Performance Tuning Guide
- MySQL Query Performance Tuning by Jesper Wisborg Krogh
Trackbacks/Pingbacks